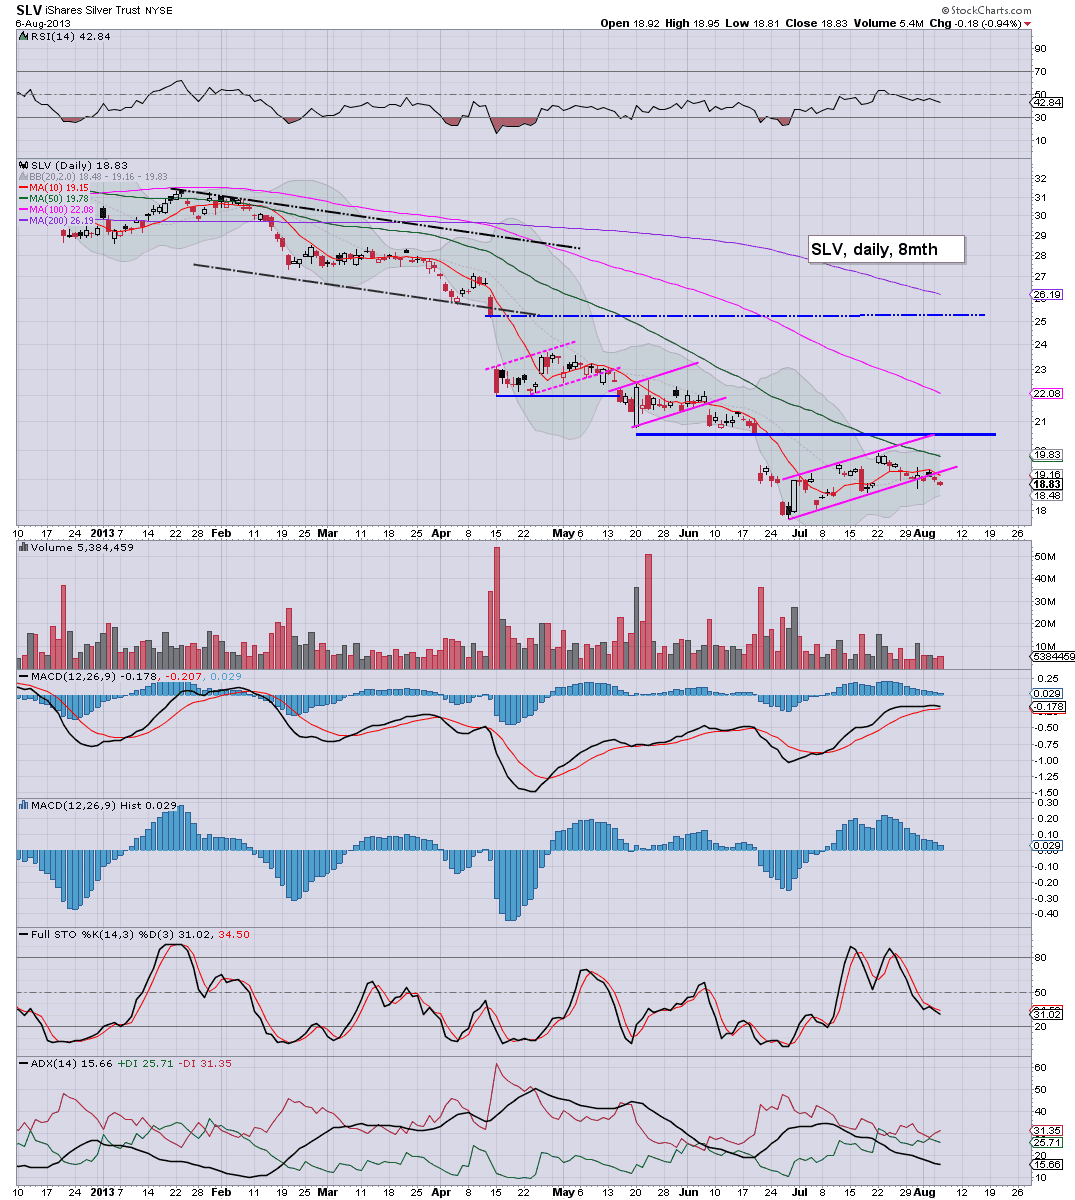
The precious metals tried for over two weeks to re-take the broken support from May/June, but have failed. Gold and Silver closed lower by 1.3% and 0.9% respectively. Near term trend looks very weak, and another 2-4 day collapse wave looks viable within the next 2-3 weeks.
GLD, daily
SLV, daily
Summary
Once again, the metals have failed. What was a potentially very important bull flag, has now been arguably negated.
Gold and Silver are now rolling over again. The recent lows from mid-June look set to be taken out within the next few weeks.
--
Mid-term targets remain GLD in the 90s..and SLV 12/10.
Tuesday, 6 August 2013
Friday, 2 August 2013
Primary trend remains down
The bounce from the June lows has done nothing to counter the primary trend for the precious metals, which remains severely to the downside. Mid-term downside targets for Gold and Silver are unchanged, in the $900s and $12/10s respectively, which could even be hit this autumn.
GLD, monthly
SLV, monthly
Summary
The Gold bugs have been calling a floor since the metals peaked in 2011. Many are now calling a key multi-month cycle floor at the June lows, but frankly, there is nothing to suggest this is the case.
From a wave-count perspective, what we have seen since June is quite possibly a sub'4 of big (blue III). If that is the case, we should see another sharp and severe drop sometime in the next month or two.
Broad outlook is for a key multi-year cycle low sometime in the next year or two.
Gold looks set a 'final flushout' under the key psy level of $1000, if not this autumn, then next year.
If Gold is back <1000, then Silver will unquestionably be smashed down to the $12/10 zone.
--
Long term outlook for the precious metals looks great, but for those seeking Gold @ 2k (and Silver >50) in the next year or two..no...that just doesn't look likely at all.
GLD, monthly
SLV, monthly
Summary
The Gold bugs have been calling a floor since the metals peaked in 2011. Many are now calling a key multi-month cycle floor at the June lows, but frankly, there is nothing to suggest this is the case.
From a wave-count perspective, what we have seen since June is quite possibly a sub'4 of big (blue III). If that is the case, we should see another sharp and severe drop sometime in the next month or two.
Broad outlook is for a key multi-year cycle low sometime in the next year or two.
Gold looks set a 'final flushout' under the key psy level of $1000, if not this autumn, then next year.
If Gold is back <1000, then Silver will unquestionably be smashed down to the $12/10 zone.
--
Long term outlook for the precious metals looks great, but for those seeking Gold @ 2k (and Silver >50) in the next year or two..no...that just doesn't look likely at all.
Thursday, 1 August 2013
Metals back on the slide
Whilst the main equity (and to some extent) the commodity market soared, the precious metals were once again weak. Gold and Silver closed lower by 1.0% and 0.8% respectively. Despite continuing QE, the metals remain weak, and a new multi-week down cycle looks viable.
GLD, daily
SLV, daily
Summary
With each passing day that the metals remain under the old broken support of May/June, it becomes increasingly unlikely that the metals are going to be able to muster any further gains in the current up wave.
Indeed, with today's decline - as also reflected in the Gold/Silver mining stocks, it would seem the metals are seeing similar price action to late March...a failed bull flag. In that instance, it was around 3 weeks..and then in mid-April..a very severe two day collapse wave.
So..are we looking at another severe drop in the tail end of August ?
The bigger weekly/monthly charts would suggest...yes.
GLD, daily
SLV, daily
Summary
With each passing day that the metals remain under the old broken support of May/June, it becomes increasingly unlikely that the metals are going to be able to muster any further gains in the current up wave.
Indeed, with today's decline - as also reflected in the Gold/Silver mining stocks, it would seem the metals are seeing similar price action to late March...a failed bull flag. In that instance, it was around 3 weeks..and then in mid-April..a very severe two day collapse wave.
So..are we looking at another severe drop in the tail end of August ?
The bigger weekly/monthly charts would suggest...yes.
Subscribe to:
Posts (Atom)


